
Undergraduate Clinical Research Engineer Experience
by Daniel Keum
A clinical engineer works closely with clinicians while contributing to research. As a clinical engineer working at the Eye Care Centre (Figure 1), I acquired images from volunteers who participated in studies of specific retinal pathologies, like diabetic retinopathy, and assisted clinicians with OCT and intraocular lens retinal image acquisition. With the opportunity to connect with patients, clinicians, and fellow researchers, a clinical research engineer would act as a bridge between the clinic and the research lab. Despite the fact that oftentimes clinicians would be busy, not only was it important to know their research but also communicate to clinicians who were supporting the studies. Some fun yet essential tasks in the clinic were working with several different machines like IOL, Plex Elite, and the AO OCT machine and acquiring images by controlling a joystick to locate different areas of the eye.
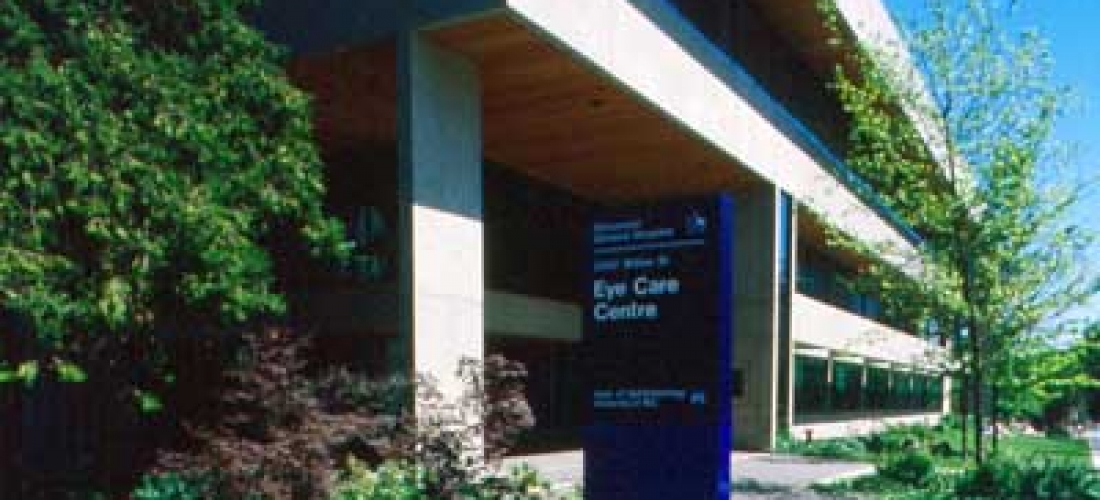
Fig 1: Photo from the outside of the Eye Care Center
With a graphical user interface, I would help identify indicators of retinal pathologies such as microaneurysms. On the research side, being a part of group discussions on how to further improve tools for obtaining good data through feedback on the usage of the AO OCT instrument (Figure 2) and suggesting improvements was a key method of communicating any issues. It was an instructive process on how to improve the image acquisition process and experiencing numerous methods to resolve acquisition issues. In addition, the group discussion enabled the exposure to other engineering great projects. Seeing the development of tools in the research lab and application in the clinic was one of many great parts of being a clinical research engineer.
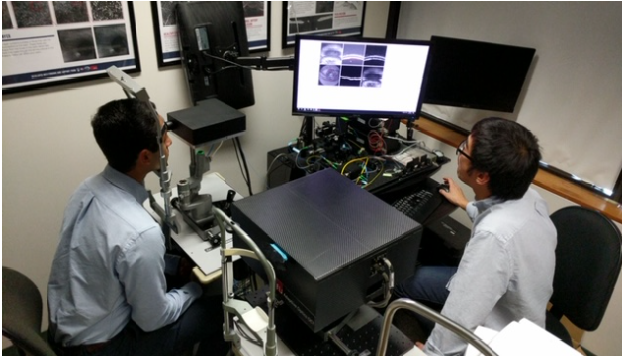
Fig 2: Real time image acquisition process
Adaptive Optics OCT and Segmentation Software
The SFU designed OCT instrument is based on Adaptive Optics (AO) technology that originally developed for telescopes, and has the capability of obtaining higher resolution images compared to standard systems. A photograph of the SFU AO OCT instrument is in Figure 3. With this non-invasive and safe technology, clinicians are able to visualize the retina with finer detail, on the order of individual cells. I helped to develop an image acquisition protocol with the AO OCT instrument, and was responsible for acquiring the AO OCT volumes. I also processed the data utilizing a layer segmentation tool known as graphcuts for 3 retinal layers: ILM, INL, and ONL for each b-scan of the volume, with representative results in Figure 4. The layer segmentation separated the regions of the retina in preparation for use as input to a neural network that would help visualize the en face images.
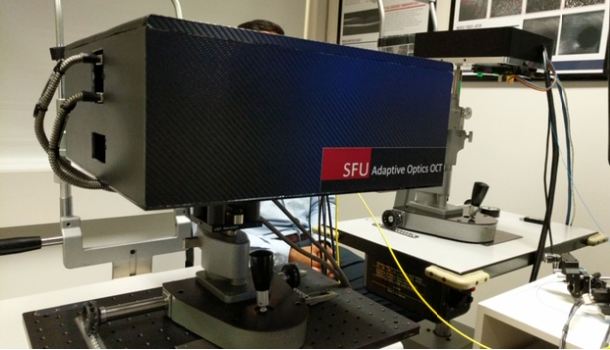
Fig 3: A closer look at the Adaptive Optics OCT machine at the Eye Care Center research room
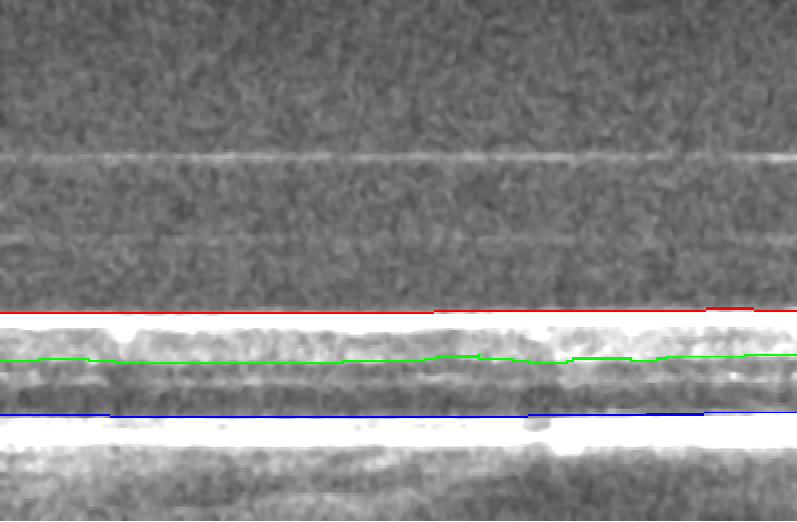
Fig 4: There are 3 layer segmentations obtained from graphcuts: ILM (internal limiting membrane) is in red, the INL (inner nuclear layer) is in green and ONL (outer nuclear layer) is in blue.
Transition to Technical Aspects
Software development
A technical aspect of my role was developing a software for analyzing OCT volumes and the associated en face images. The initial graphical user interface (GUI) was developed by another undergraduate student, Daria Zhevachevska - my job was to further develop and add new tools to this GUI. Collaborating with Daria and graduate student researchers Julian Lo and Timothy Yu, I combined several different matlab scripts such as vessel segmentation into one software tool that could simply run with a click of a button. In order to help the clinician end-users, I wrote up simple instructions and built in error messages to the GUI in order to let the user know what actions are possible, and incorporated exception handling into the GUI software. With the ever evolving software and new updates, I hope to develop a complete tool so that other researchers can simply extract the relevant clinical information from the OCT volumes. A screen capture of the GUI is shown in Figure 5.
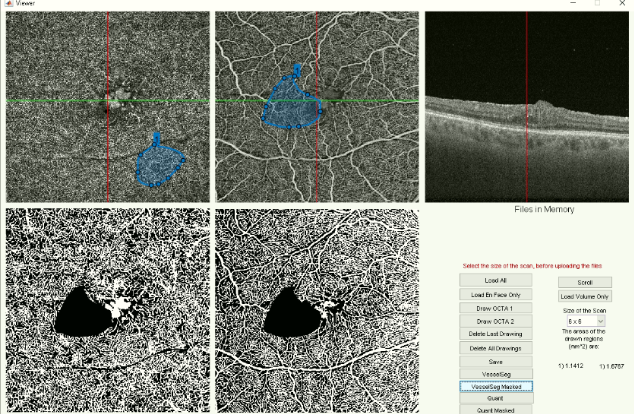
Fig 5: Matlab graphical user interface with a masking applied on the top middle OCTA image and applied in the vessel segmentation image.
Vessel Tortuosity Project
The vessel tortuosity project is important in detecting the first signs of microvascular alterations within the retina, which are early indications of vision threatening disease. Together with the development of SFU BORG advanced vessel segmentation code, and using a vessel tortuosity method described in the Literature, the goal of this project is to identify the tortuosity of small vessels (capillaries) in the retina. I am creating a matlab script in order to achieve this goal. Following the image analysis methods described by Khansari et al. [1] as a basic guideline in obtaining vessel tortuosity index, I made adjustments to several image processing steps to take advantage of the vessel segmentation tools developed by the BORG team. Representative results are presented in Figure 6.
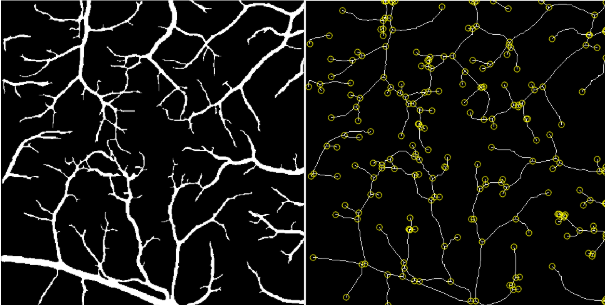
Fig 6: (Left) Large vessels were extracted from the vessel segmentation image by using a thresholding method. (Right) The vessel endpoints were calculated to compute the VTI for each individual capillary segment.
Reference
[1] M. M. Khansari, W.
O'Neill, J. Lim, and M. Shahidi, “Method for quantitative
assessment of retinal vessel tortuosity in optical coherence
tomography angiography applied to sickle cell retinopathy,”
Biomedical optics express, 24-Jul-2017. [Online]. Available:
https://www.ncbi.nlm.nih.gov/pmc/articles/PMC5560841/. [Accessed:
12-Jun-2020].