Wavefront sensorless adaptive optics optical coherence tomography for in vivo retinal imaging in mice


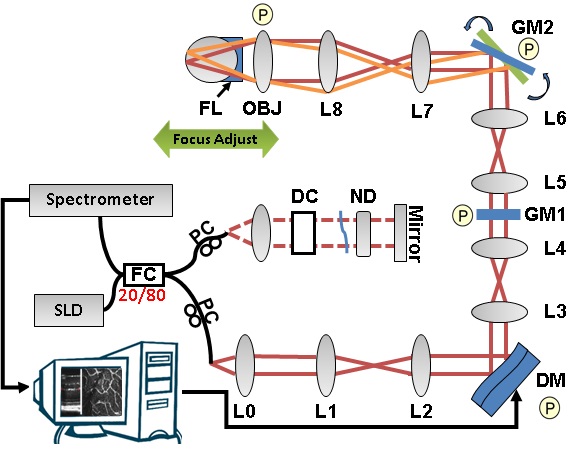
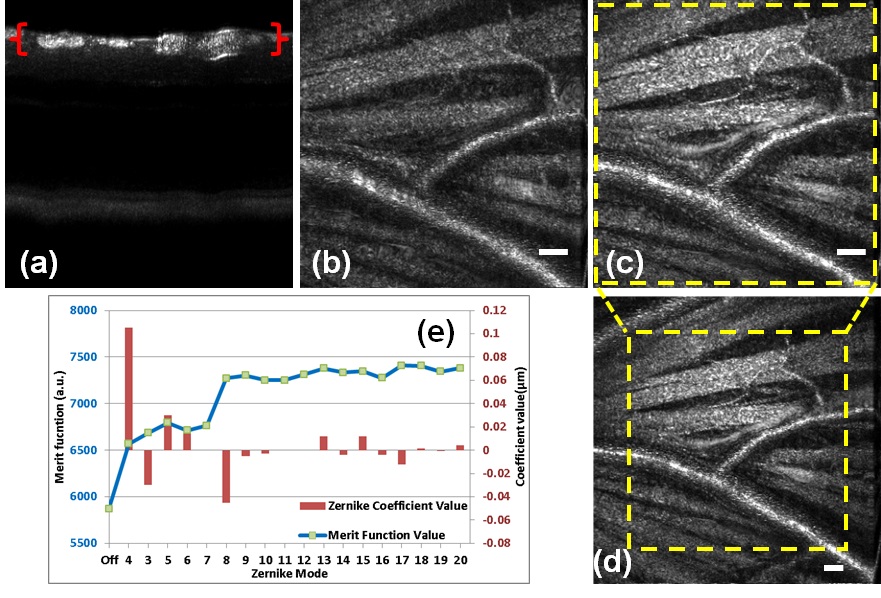
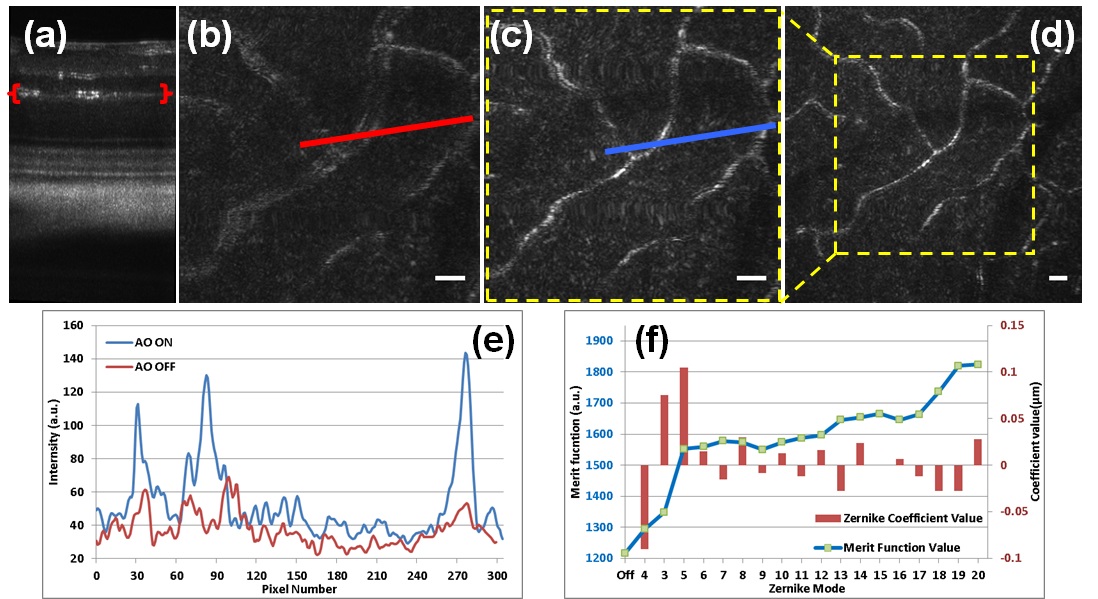
We present wavefront sensorless adaptive optics (WSAO) Fourier domain optical coherence tomography (FD-OCT) for in vivo small animal retinal imaging. WSAO is attractive especially for mouse retinal imaging because it simplifies optical design and eliminates the need for wavefront sensing, which is difficult in the small animal eye. GPU accelerated processing of the OCT data permitted real-time extraction of image quality metrics (intensity) for arbitrarily selected retinal layers to be optimized. Modal control of a commercially available segmented deformable mirror (IrisAO Inc.) provided rapid convergence using a sequential search algorithm. Image quality improvements with WSAO OCT are presented for both pigmented and albino mouse retinal data, acquired in vivo.

Corresponding information:


Please send an e-mail to yjian@sfu.ca for more information.

Figures and Videos

Figure 1: Schematic of the WSAO FD-OCT system: DC - dispersion compensation; DM - deformable mirror; FC - 20/80 fiber coupler, 20% of the light from SLD goes to sample arm, 80% goes to reference arm; GM1, GM2 - horizontal and vertical galvo scanning mirrors; FL - fundus lens; PC - polarization controller. SLD - superluminescent diode; L - achromatic lenses: L0: (f = 16mm); L1, L2: (f = 300mm); L3, L4: (f = 200mm); L5, L6: (f = 150mm); L7, (f = 100mm) L8: (f = 300mm); OBJ - objective: (f = 25mm); ND - neutral density filter; P represents the location of the planes conjugated to the pupil throughout the system. GM1 is slow scan mirror and is presented unfolded for clarity. Note that the schematic is drawn for illustrative purposes only; it does not reflect the actual physical dimensions of the system.


Figure 2: WSAO OCT images of NFL of a pigmented mouse. (a) OCT B-scan in linear scale, emphasizing the location and depth of focus of the imaging beam at the NFL. (b-d) En face projection of the nerve fiber layer (generated within the red brackets in (a)) before (b) and after (c) WSAO optimization. (d) was acquired with a larger field of view after WSAO optimization. (e) (Blue line graph) The summed intensity (merit function value) of en face images after optimization of each Zernike mode. (Red bar graph) The optimized Zernike coefficient value for each Zernike mode. The RMS of the wavefront applied by the DM is 0.125µm. Scale bar: 25μm.


Figure 3: (a) Cross sectional images of the albino mouse retina acquired in vivo with the sensorless WSAO OCT system presented on a linear scale. The axial depths indicated by the brackets represent the location of the en face projection of the retinal layers of interests with AO-OFF (b) and AO-ON (c,d). Scale bar: 20μm. (e) The effect of AO correction is demonstrated by comparing the signal intensity across lines taken from the en face images at locations (b, red) and (c, blue). (f) (Blue line graph) The summed intensity (merit function value) of the en face images after optimization of each Zernike mode. (Red bar graph) The optimized Zernike coefficient value for each Zernike mode. The RMS of the wavefront applied by the DM is 0.175µm.


Figure 4: Demonstration for real-time optimization for wavefront sensorless Adaptive Optics OCT


Figure 5: Second Demonstration for real-time optimization for wavefront sensorless Adaptive Optics OCT


Reference


Y. Jian, J. Xu, M.A. Gradowski, S. Bonora, R.J. Zawadzki, and M.V. Sarunic. "Wavefront sensorless adaptive optics optical coherence tomography for in vivo retinal imaging in mice." Biomedical Optics Express 5, no. 2 (2014): 547-559.