
Integrated OCT and SLO for Small Animal Retinal Imaging
Scanning Laser Ophthalmoscopy (SLO) and Coherence Tomography (OCT) are complimentary retinal imaging modalities. Integration of SLO and OCT allows for both fluorescent detection and depth- resolved structural imaging of the retinal cell layers to be performed in-vivo. System customization is required to image rodents used in medical research by vision scientists. We are investigating multimodal SLO/OCT imaging of a rodent model of Stargardt's Macular Dystrophy which is characterized by retinal degeneration and accumulation of toxic autofluorescent lipofuscin deposits. Our new findings demonstrate the ability to track fundus autofluorescence and retinal degeneration concurrently.
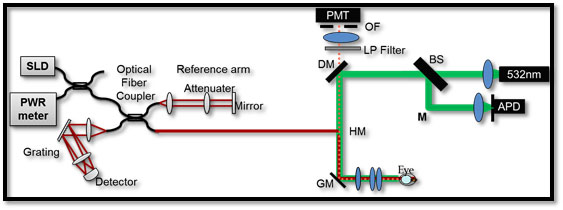
The integration of FDOCT with cSLO is facilitated by the similarities and differences of the two sub-systems's details. Since both FDOCT and cSLO are raster scanning modalities, a common set of galvanometer mounted mirrors can be used to scan the beam on the sample. Aligning the beams to be co-linear ensures that the same region on the sample is imaged. The FDOCT sub-system operates in the infrared to optimize tissue penetration. By selecting the cSLO to operate in the visible wavelength, simple heat control optics can be used to combine the two systems [1-5].The integrated FDOCT-cSLO system is schematically presented in Figure 1.
Representative cSLO image acquired from an albino mouse isshown in Figure 2.

The quality and brightness of the cSLO image of an Albino ABCA4 mouse (Figure 3b) is similar to that of the control mouse (Figure 3a). However, in the fundus autofluorescence (FAF) image, we can clearly see the auto fluorescence on the albino ABCA4 which is due to much higher amount of lipofuscin accumulation compared to the control mouse's FAF image.


Alignment of the field of view with the OCT system is time consuming because of the slow volume acquisition rate (several seconds), and was greatly facilitated by the use of the cSLO sub-system (~2 frames per second). The OCT, once aligned to the right location on the retina based on the landmarks of the blood vessels, can be used to acquire 3D volumetric images, as it is shown in Figure 5. In this example, we used a custom system designed at SFU with an 86nm bandwidth. The importance of the FDOCT is that it can be used for quantitative imaging of retinal degeneration, and thinning of layers.

In Figure 6, averaged FDOCT B-scan of the retinal cell layers is shown. We are examining the retinal diseases (such as glaucoma), which affects the retinal nerve fiber layer, we would make measurements on the top portion (top arrows). In another case study, we examine diseases, which causes the loss of photo receptors (such as stardardt's macular dystrophy), and we would measure the changes on the thickness of the outer nuclear layer (ONL).

REFERENCES
1. Pircher, M., R.J. Zawadzki, J.W. Evans, J.S. Werner, and C.K. Hitzenberger. Simultaneous imaging of human cone mosaic with adaptive optics enhanced scanning laser ophthalmoscopy and high-speed transversal scanning optical coherence tomography. Opt Lett. 2008; 33(1):22-42. Rosen, R.B., M. Hathaway, J. Rogers, J. Pedro, P. Garcia, G.M. Dobre, and A.G. Podoleanu. Simultaneous OCT/SLO/ICG imaging. Invest Ophthalmol Vis Sci. 2009; 50(2):851-60.
3. Bigelow, C.E., N.V. Iftimia, R.D. Ferguson, T.E. Ustun, B. Bloom, and D.X. Hammer. Compact multimodal adaptive-optics spectral-domain optical coherence tomography instrument for retinal imaging. J Opt Soc Am A Opt Image Sci Vis. 2007; 24(5):1327-36.
4. N. Javaheri, L. L. Moldy, J. Xu, R. S. Molday, M. V. Sarunic. Imaging retinal degeneration in mice by combining Fourier domain optical coherence tomography and fluorescent scanning laser ophthalmoscopy. Multimodal Biomedical Imaging IV. 2009; Proc. of SPIE Vol. 7171.
5. A. Issaei, L. Szczygiel, M.V. Sarunic, "Integrated scanning laser ophthalmoscopy and optical coherence tomography for quantitative multimodal imaging of retinal degeneration and autofluorescence," Multimodal Biomedical Imaging VI, Photonics West, F. S. Azar, Becton, Dickinson and Co.; X. Intes, Rensselaer Polytechnic Institute, Proc. SPIE, vol. 7892, (2011).