Adaptive optics optical coherence tomography for in vivo mouse retinal imaging


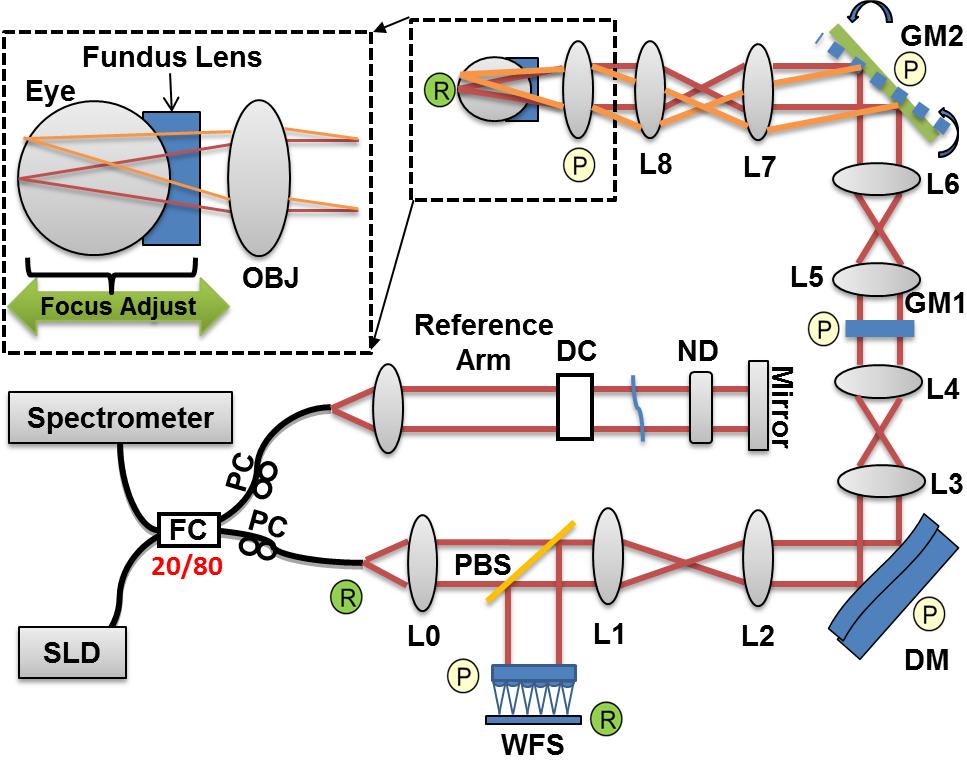
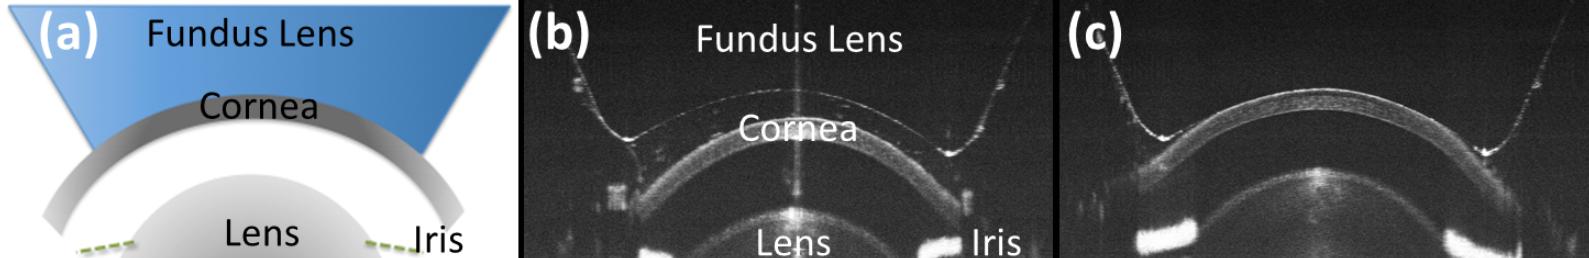
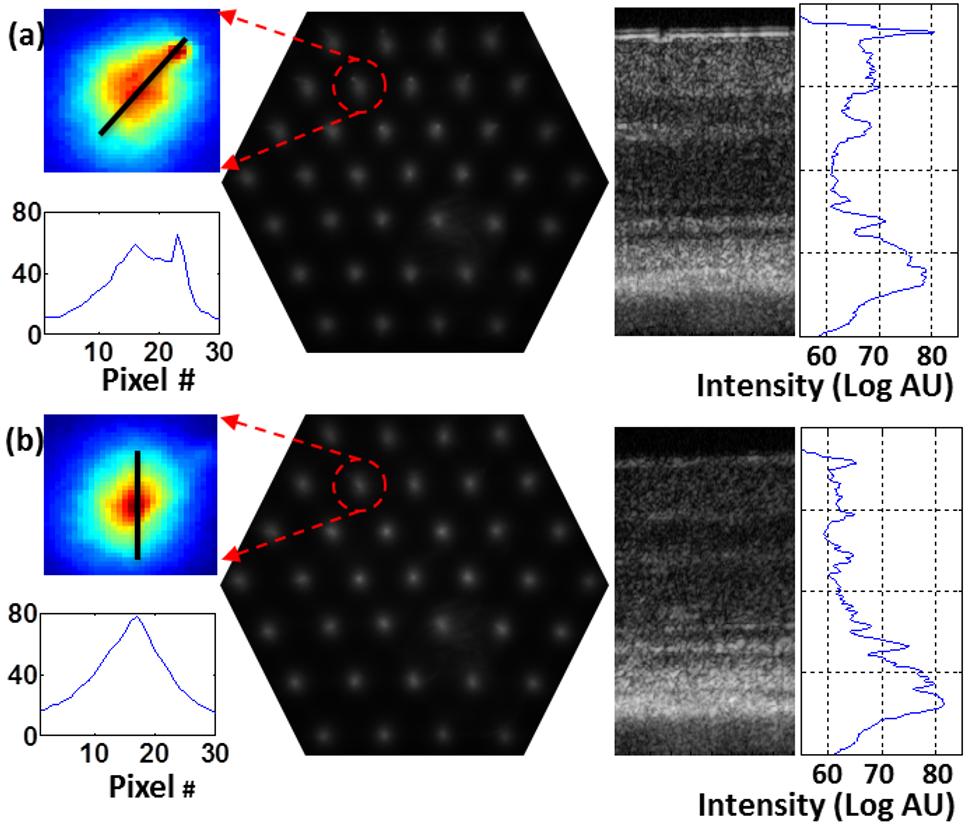
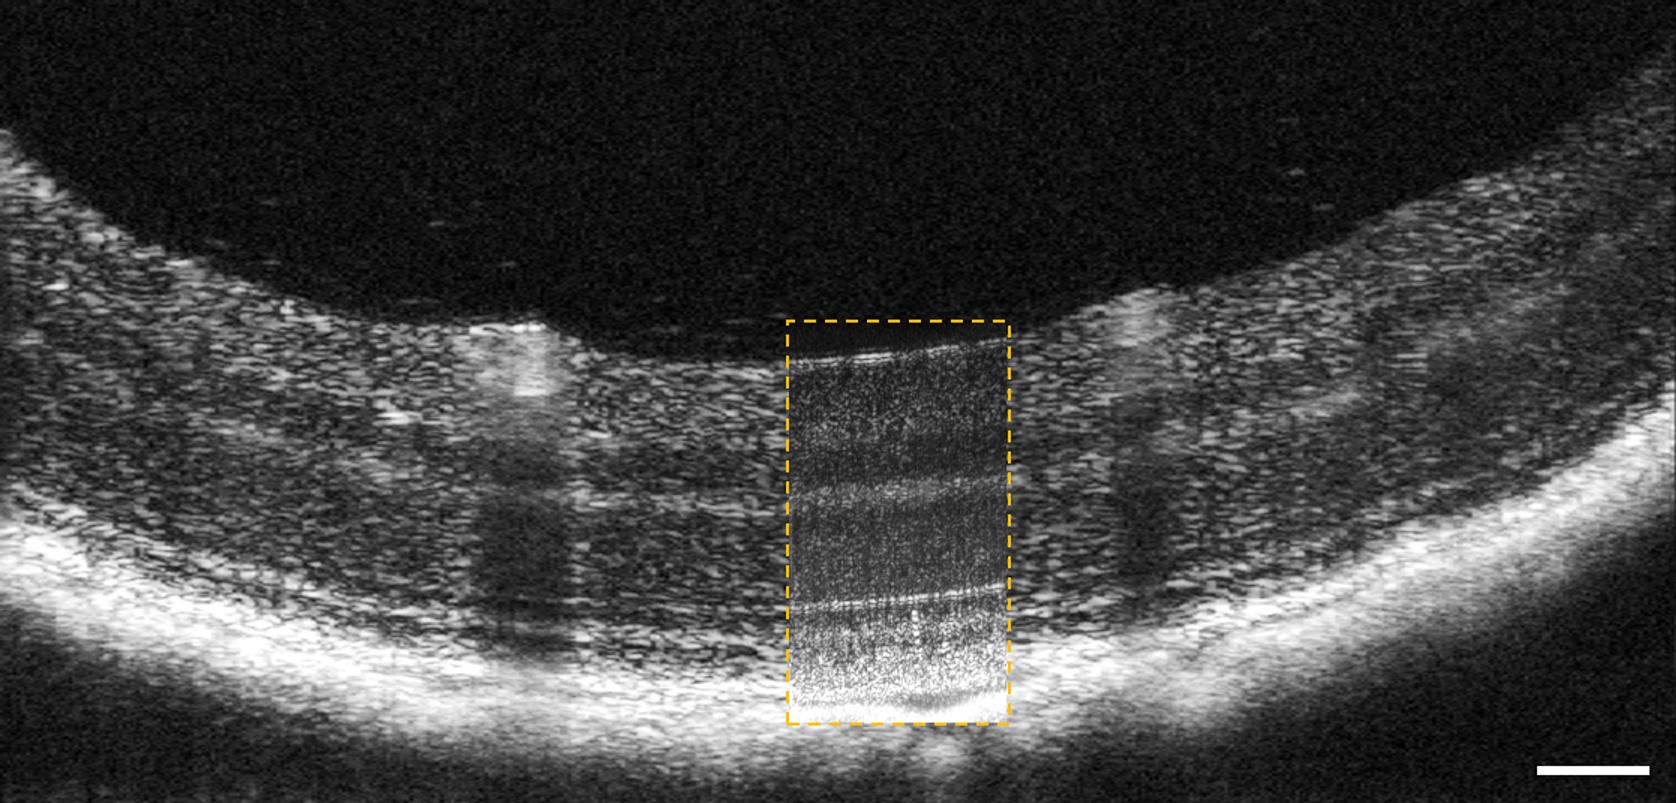
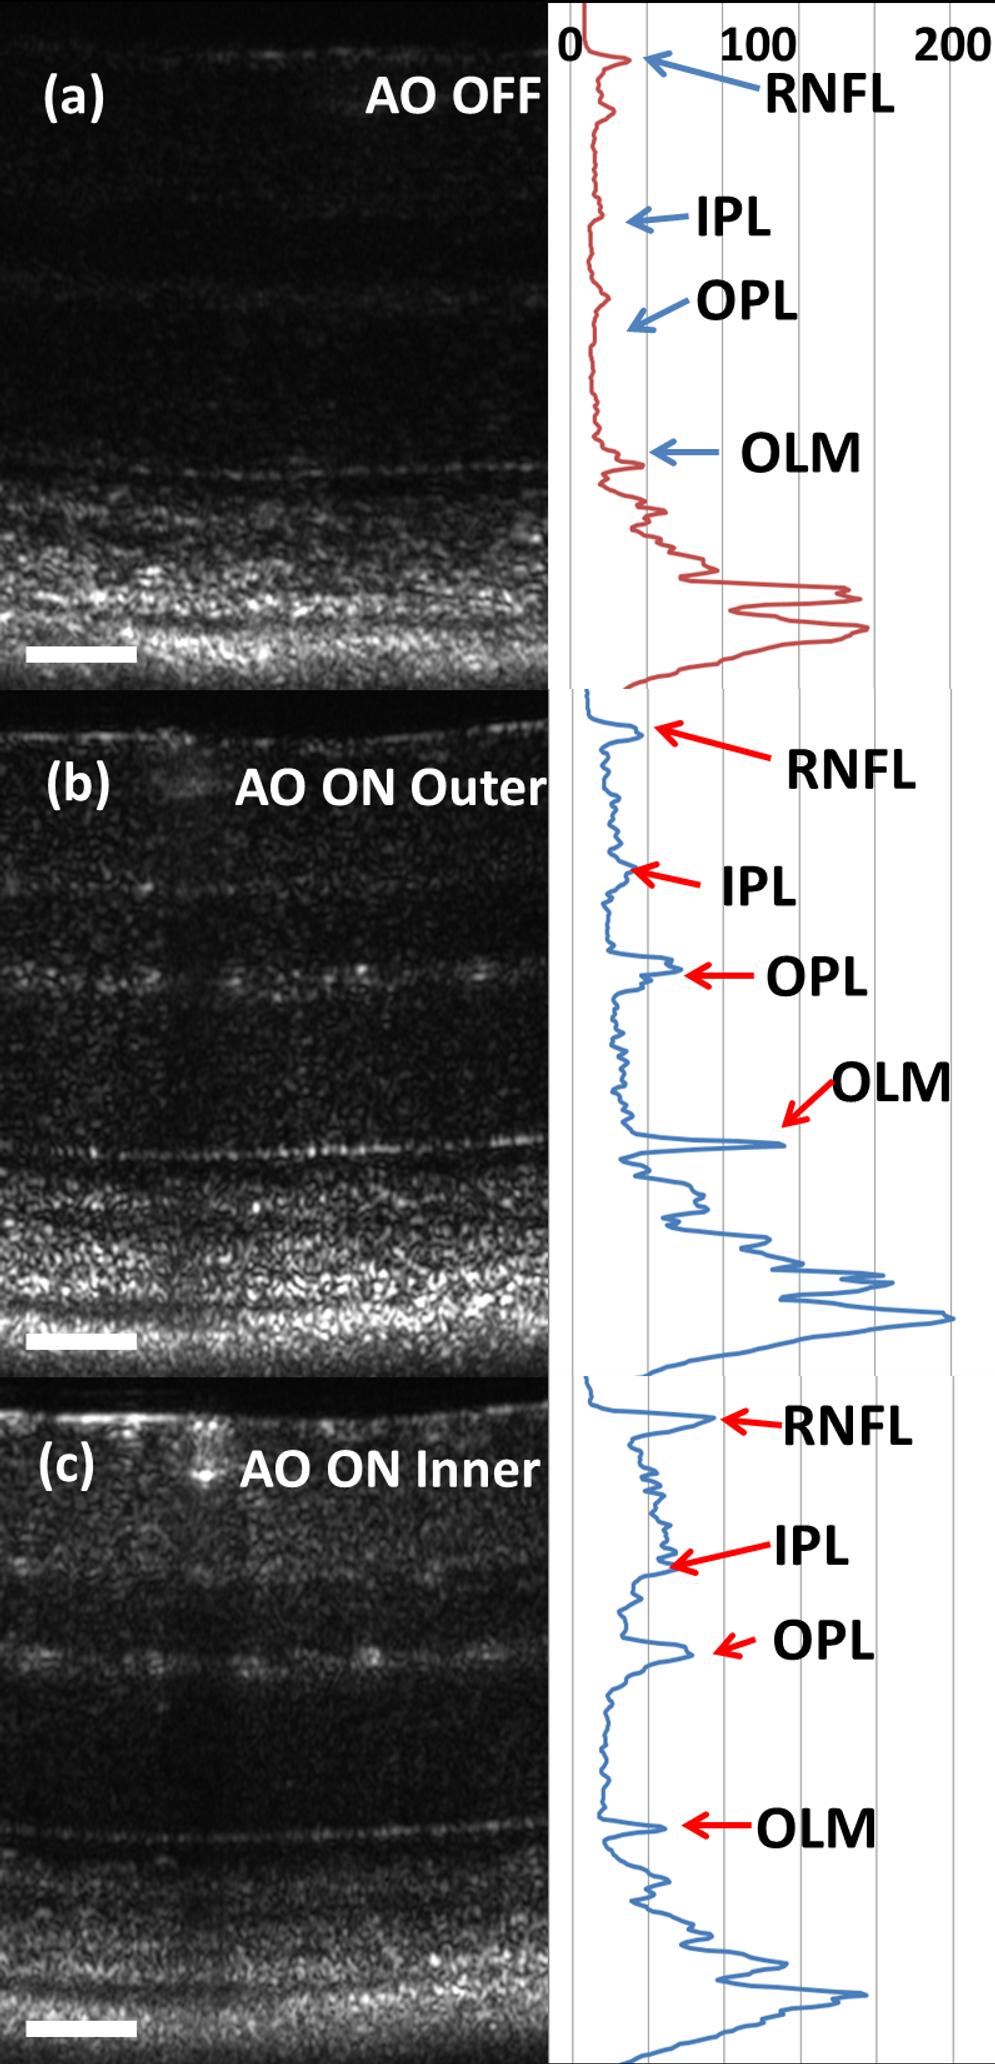
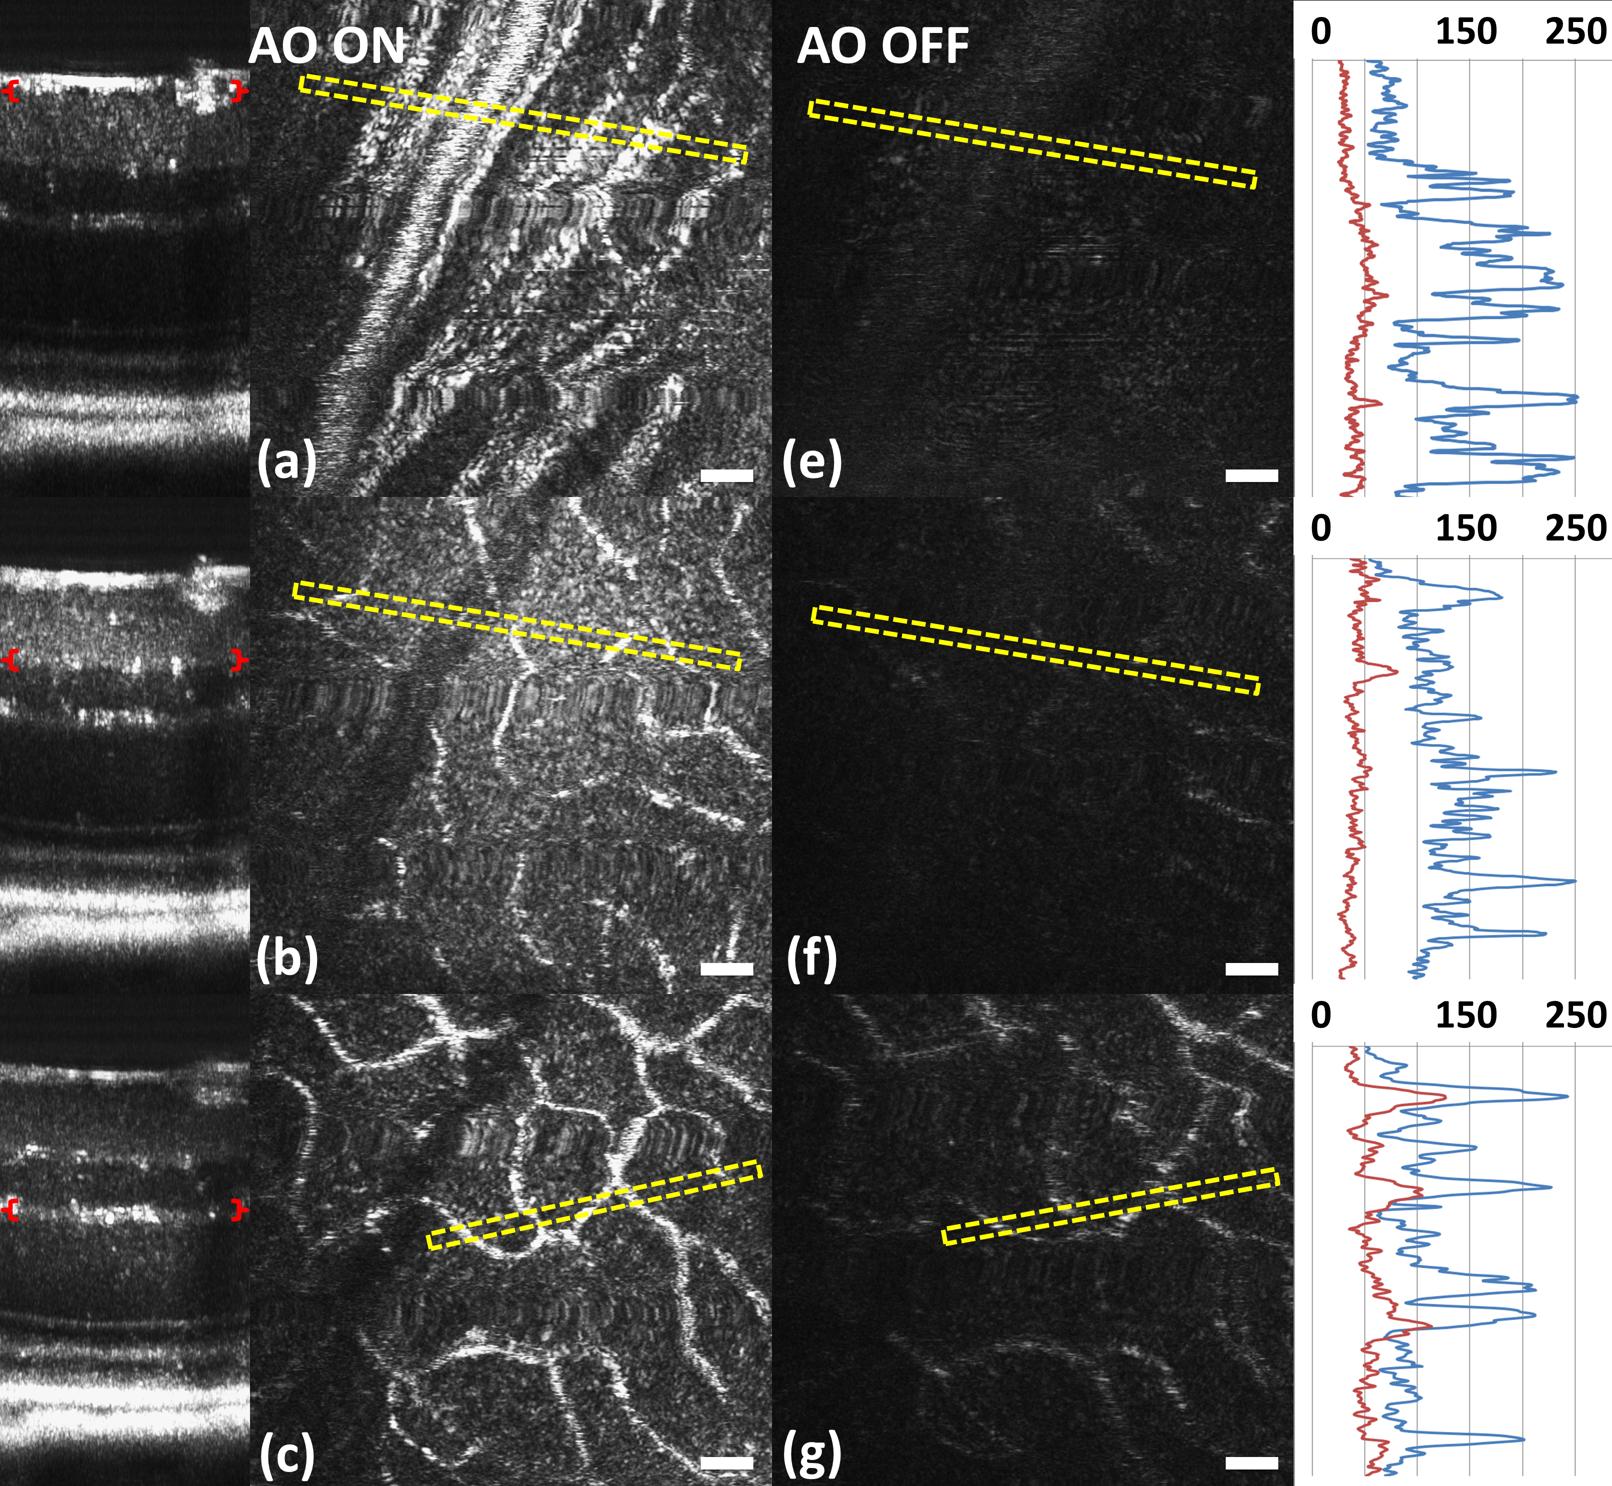
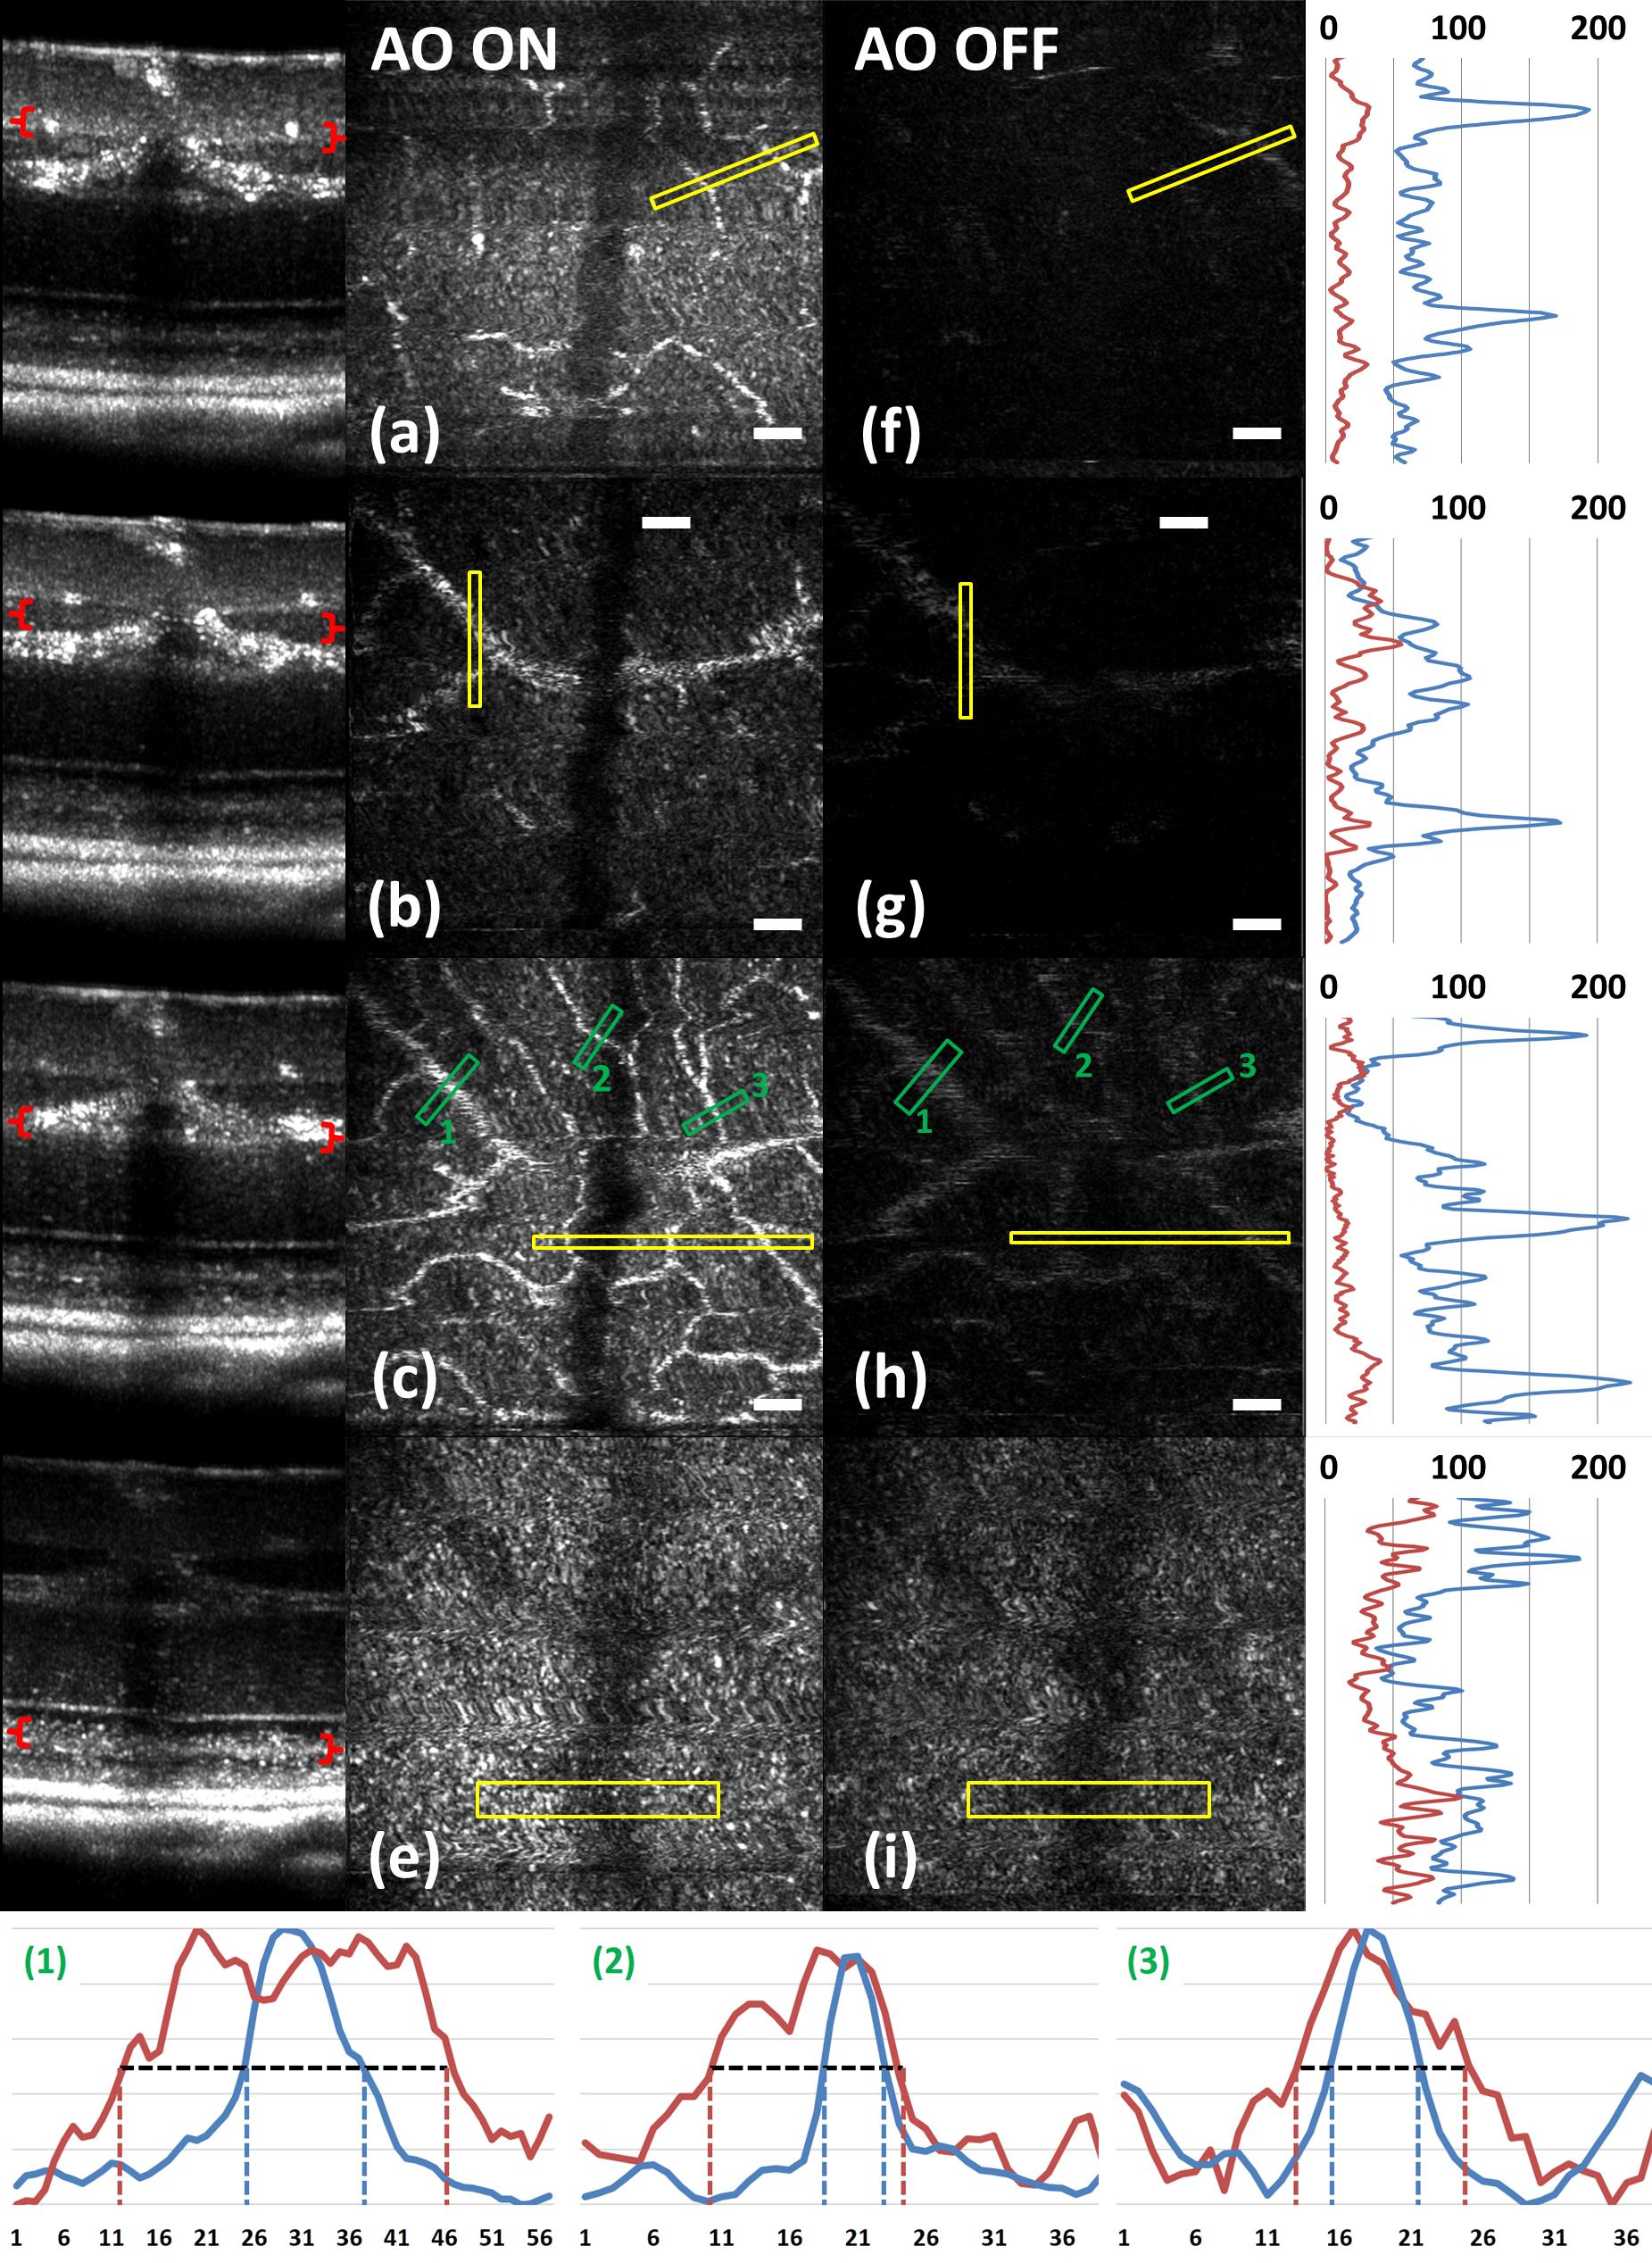
Small animal models of retinal diseases are important to vision research, and noninvasive high resolution in vivo rodent retinal imaging is becoming an increasingly important tool used in this field. We present a custom Fourier domain optical coherence tomography (FD-OCT) instrument for high resolution imaging of mouse retina. In order to overcome aberrations in the mouse eye, we incorporated a commercial adaptive optics system into the sample arm of the refractive FD-OCT system. Additionally, a commercially available refraction canceling lens was used to reduce lower order aberrations and specular back-reflection from the cornea. Performance of the adaptive optics (AO) system for correcting residual wavefront aberration in the mice eyes is presented. Results of AO FD-OCT images of mouse retina acquired in vivo with and without AO correction are shown as well.

Corresponding information:


Please send an e-mail to yjian@sfu.ca for more information.

Figures and Videos


Figure 1: Schematic of the small animal AO FD-OCT system.


Figure 2: (a) Schematic of the fundus lens positioned at the mouse cornea. (b) OCT image of a fundus lens near the cornea. (c) OCT image of a fundus lens in contact with the cornea.


Figure 3: Images from the WFS camera and corresponding log scale Bscans acquired simultaneously at the same location. A single WFS spot (in the red dotted circles) are shown at higher magnification in the heat maps, and the corresponding intensity profiles were taken at the position of the black line. (a) WFS image with nonoptimized focus. (b) WFS images acquired with the beam focus optimized on the outer retinal layers.


Figure 4: A comparison of regular rodent OCT B-scan with high resolution AO-OCT B-scan (inside yellow dotted box acquired with AO-ON). Both images were acquired from C57BL/6J (pigmented) mouse, and were generated by averaging 20 motion-corrected B-scans. A logarithmic intensity scale was used for both sets of data. Note the smaller speckle size seen on AO FD-OCT inset. Scale bar: 100 μm.


Figure 5: In vivo OCT B-scans images (left) acquired at the same eccentricity from the retinas of C57BL/6J (pigmented) mice and depth intensity profiles (right); (a) was acquired when AO is turned off (DM flat), (b) was acquired when AO was activated and the focus was set on the outer retina, and (c) was acquired when AO was activated and shifting the focus through the AO software to the inner retina. Images (a), (b), and (c) were generated by averaging 20 B-scans and are presented on a linear intensity scale. Scale bar: 50 μm


Figure 6: Cross-sectional images of the mouse retina acquired in vivo with the AO FD-OCT system. The focal plane was set on the inner retina by changing the defocus in the AO control software. The axial depths indicated by the brackets in the B-scan represent the locations of (a) to (c) en face projections of different retinal layers with AO-ON and (d) to (f) en face projections at the same location with AO-OFF (DM flat). Scale bar: 30 μm.


Figure 7: Cross-sectional and en face images (IPL, INL, OPL and PRL) of the mouse retina acquired in vivo with the AO FD-OCT system. The focal plane was adjusted on the layers of interest as indicated by the red brackets in the B-scan images by changing the defocus in the AO control software. The axial depths indicated by the brackets in the B-scan represent the locations of (a) to (d) en face projections of the different retinal layers with AO-ON and (e) (h) en face projections at the same location with AO-OFF (DM flat). Normalized line graphs of the image intensity taken across the capillaries at the locations labeled 1, 2, and 3 in (c) and (g) are presented in the bottom panel. Scale bar: 30 μm.


Reference


Y. Jian, R.J. Zawadzki, M.V. Sarunic. "Adaptive optics optical coherence tomography for in vivo mouse retinal imaging." Journal of biomedical optics 18, no. 5 (2013): 056007-056007.